I can’t deny it, I’m a little bit of a politics nerd. I’m fascinated by polling, predictions and understanding why people vote the way they do. I’m also a fledgling data nerd, who helpfully dabbles in writing little apps and games too. So I thought I’d combine all of these interests into a project where I’m going to try and better understand how Cornwall votes politically, starting with visualising the 2025 local elections.
What happened in the 2025 Cornwall elections?
Cornwall followed a familiar trend seen across the country. The Conservative vote collapsed (47 seats down to 7) and the Reform vote surged (28 up from 0). The Lib Dems also did well doubling their total number of seats (from 13 to 26) and Labour remained essentially irrelevant (taking 4, down from 5). The Greens along with a special shout out to Cornish nationalist party Mebyon Kernow each took home 3. Crucially no party crossed the 44 seat threshold for a majority and the council remained under no overall control. Since the election a Lib Dem has been appointed leader of the council, much to Reform’s frustration having won the most seats… but we won’t go into that argument in this post!
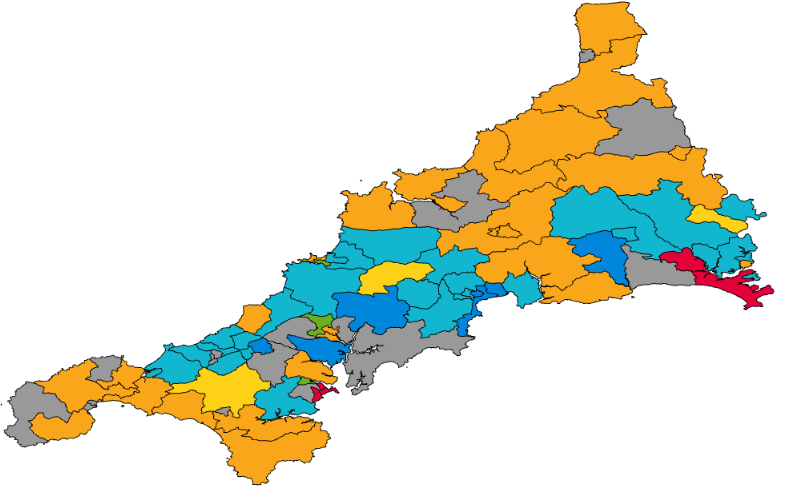
Labour’s poor performance is particularly interesting as they won 4 of the 6 available parliamentary constituencies in the 2024 general election which is by far their best ever performance in Cornwall. Looking at the map we can see they performed favourably in the big student town of Falmouth, as well as in wards close to the Devon border adjacent to Plymouth – a Labour voting city.
How to generate a local election map
The map you see above was generated by me using Open Data made available by the UK Government. In particular it was made using the Ward Dataset. I won’t go into excruciating technical detail about how I generated this for now, but essentially the process was:
- From the 6,000+ wards extract the Cornish ones using by using a VLOOKUP against a list of Cornish ward names.
- Delete most of the data so we’re only looking at the name of the ward and its co-ordinates.
- Figure out how Geo co-ordinates actually even work and perform some Excel wizardry to parse them into something sensible.
- Generate a JSON file with all of the ward names, their co-ordinates and how they voted.
- Load that into a Phaser 3 project powered by Vite and draw the co-ordinates as shapes.
It’s worth mentioning that I had absolutely no experience of generating maps from Geodata before this. Also let me tell you… I can’t begin to explain the difficulty I had in sourcing this data! I went through all kinds of Ordnance Survey maps and other services before I stumbled across it. So hopefully this is all a useful starting point to someone out there.
Lessons from generating maps
St Agnes St Agnes
When I generated my initial map I hadn’t noticed the small ward of St Agnes wasn’t being drawn (it’s on the coast and easily missed). Strangely a land mass was also being drawn out at sea off the coast of Land’s End. Of course I had no idea that there was also a St Agnes within the picturesque Isles of Scilly! If I was a half-decent programmer my VLOOKUP should have spotted there was more than one St Agnes in the data set. Oops.
Wards within wards
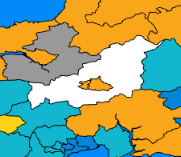
Another interesting Cornish ward is that of Lanivet, Blisland and Bodmin St Lawrence which excitingly contains within it, the wards of; Bodmin St Mary’s and St Leonard and Bodmin St Petroc’s – giving it a kind of donut shape. Naturally as the two within it come first alphabetically, they were being drawn first, and then “vanishing” when their surrounding ward was drawn on top of them. My code still doesn’t handle donut shapes and right now I’m just making sure I draw Lanivet, Bisland and Bodmin St Lawrence first with the other two layered on top.
What next?
In writing this post my mind is already filled with interesting tangents to explore! Why did Labour do so well in Falmouth? How did Mebyon Kernow get seats in three very different parts of the county? What does this all say for the 2029 general election?
Stay tuned for more!